Quick Start Guide to Docker Compose Logs.

Docker Compose
Docker Compose is a powerful tool that comes bundled with Docker, designed to simplify the development and management of multi-container applications. With Docker Compose, you can define and configure all your application’s services, networks, and volumes in a single docker-compose.yml file, enabling you to easily manage complex environments. This approach streamlines the process of spinning up and tearing down entire application stacks with just a few commands, making development, testing, and deployment much more efficient. By orchestrating the interactions between various containers, Docker Compose ensures that each service starts in the correct order, handles dependencies, and operates seamlessly, enhancing productivity and reducing the potential for errors in multi-container setups.
Docker allows you to package your applications into small, self-contained containers that can run seamlessly on any operating system without worrying about dependencies. Think of it as putting your apps into little boxes called Containers, which ensures they run the same way, everywhere. Before diving into Docker Compose, it’s crucial to understand containers. For a deeper dive, check out our blog on the benefits of containerization.
Docker Compose, included with Docker, takes the hassle out of developing complex, multi-container applications by linking their services, networks, and storage. With Docker container logs and Docker Compose logging, developers can easily monitor the actions of each container.
Prominence of Docker Compose Logs
Imagine a developer launches an app with Docker but skips setting up Docker logs. Initially, everything runs smoothly. However, users soon encounter errors, and the app begins to slow down. Without Docker logs, the developer can’t pinpoint what went wrong inside the Docker containers. Docker Compose logs provide a detailed record of these containers, capturing every event and action, which is crucial for diagnosing and fixing issues later.
As a Developer or System Admin, understanding what happens inside and between multi-container applications is essential. This is where Docker Compose logs come in handy. So, why are these logs necessary?
-
Troubleshooting and Debugging
Check docker logs when an application isn’t running correctly or encounters errors. Docker logs are the first resources you can look at to trace the issue. By examining the docker logs, developers can pinpoint the root cause and source of problems, whether it’s a bug in the code, a misconfiguration, or resource issues.
-
Monitoring Application Health
Regularly monitoring application logs helps to understand the overall health of services. Logs can reveal early warning signs, such as repeated errors and slow responses. Observing these patterns early can prevent potential issues in the future.
-
Audit and Compliance
For applications that need to follow specific standards, docker logs are the first piece of evidence showing whether the application adheres to guidelines. These logs also play an essential role in monitoring authorized or unauthorized activities.
-
Optimization
Logs are valuable resources for software optimization by providing performance data. For instance, developers can identify slow-running queries, inefficient code paths, or underutilized resources.
Building a Web Server with Docker
In this exquisite segment, we shall gracefully embark on the art of crafting a Docker recipe. Before we commence our voyage with Docker Compose logs, it is imperative that we construct a foundation. For this noble cause, let us summon a majestic web server into existence. To fashion a Dockerfile, gracefully execute the command “nano Dockerfile” within the chosen directory on your esteemed VPS. Fill it with the following enchanting contents and preserve its magnificence for eternity:
FROM nginx:alpine RUN rm /usr/share/nginx/html/index.html EXPOSE 80 CMD [“nginx”, “-g”, “daemon off;”]
So, what does each line of this code do?
- We start with a lightweight base, nginx:alpine.
- Next, we clear out the default welcome page of Nginx.
- Then, we make sure that the web server is listening on port 80.
- Finally, we run the Nginx server with CMD.
Now our Dockerfile is ready, we’ll move on to the next step, which is creating the Docker Compose file. Here’s the structure of the docker-compose.yml file:
version: ‘3.8’ services: web: build: . ports: – “8080:80” volumes: – ./index.html:/usr/share/nginx/html/index.html
Let’s break it down to understand each part completely:
- We’re using version 3.8.
- On the next line, we name our service “web“.
- Then, we instruct Docker to build our web server from the current folder.
- We link port 8080 on our host to port 80 in our container to enable our web server to establish a connection.
- Finally, the volumes configuration maps index.html from the host disk to the container. Later, you can create an index.html file with any content you want and place it where the Dockerfile and docker-compose.yml files exist.
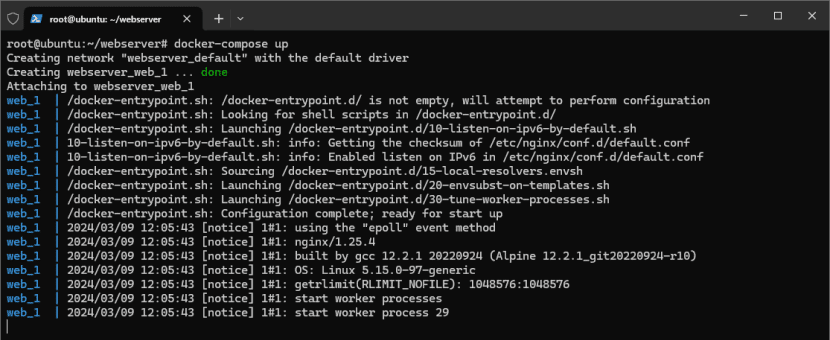
Now it’s time to run our Docker container with Docker Compose. Simply, we run docker-compose up.

Once you run the docker-compose up command, Docker will download the required images from the internet and configure them as instructed in our configuration files.
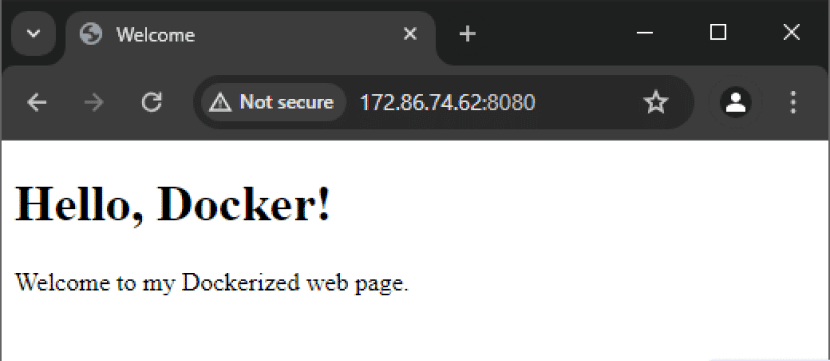
To check if our web server is up and running, open your web browser, type in your VPS IP address, and request access to port 8080.

As a side note, you can use docker-compose up -d to run the container in the background.
Accessing Logs
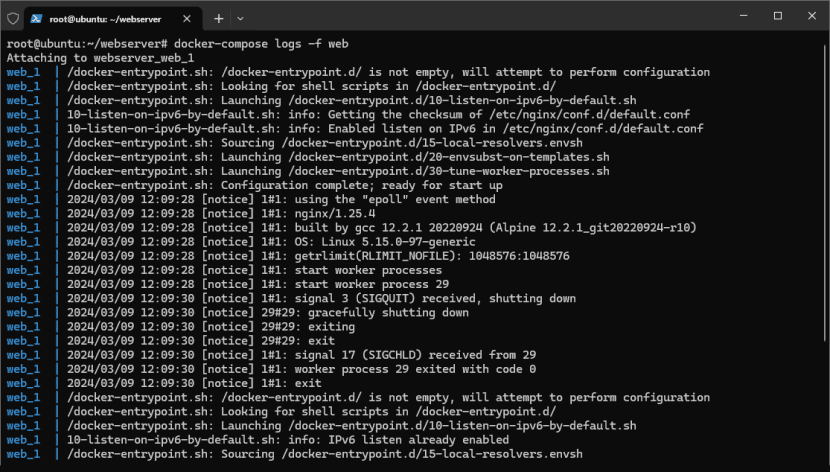
Our web server is fully operational, generating logs, and storing crucial information for future reference. Accessing your docker compose logs is vital for troubleshooting and monitoring purposes. To read these logs effectively, utilize the docker-compose logs command after navigating to the appropriate folder where the configuration is located.

Sometimes, you might want to see the live version of the logs as they are generating. Simply add -f at the end of the previous command and run docker-compose logs -f.
Some Docker-based applications may not provide you with timestamps in their logs. Therefore, you can use docker-compose logs -t to add a recorded time for each line of the log.
Docker Logs can also display the most recent entries. To achieve this, use docker-compose logs –tail 10 to view the latest 10 log entries. Docker composes logs tail, and similarly docker logs tail is particularly useful when you want to quickly check recent activity without scrolling through the entire log history.
The primary purpose of using Docker Compose is to create multi-container applications. Therefore, you may need to read specific logs for a desired service. To do so, use docker-compose logs -f SERVICE, remembering to replace SERVICE with your actual service name.
Docker Logging
The Docker environment may present challenges for integrated applications, particularly in expansive settings. It is common knowledge that every container produces logs. Hence, the Logging Driver plays a vital role in collecting, transporting, and preserving these logs. While Docker typically employs JSON files for this purpose, it offers a range of alternative drivers, each with its own advantages and disadvantages.
It is universally acknowledged that logs are indispensable in numerous domains, such as problem-solving and optimizing system efficiency. In the subsequent sections, we will delve into two key facets of leveraging container logs.
- Monitoring: Logs’ primary purpose is monitoring. They generally reveal the overall health of our containerized applications.
- Troubleshooting: In the event of issues, logs help us detect application glitches.
As docker logs and docker compose logs are continuously generated, they may fill up all the VPS storage. Therefore, we need a strategy to manage disk space called a Log Rotation Policy. To create and use this policy, return to the docker-compose.yml file and open it. Then, add a logging section with the configuration below:
version: '3.8'
services:
web:
build: .
ports:
- "8080:80"
volumes:
- ./index.htm:/usr/share/nginx/html/index.htm
logging:
driver: json-file
options:
max-size: "200k"
max-file: "10"
You can constantly adjust max-size and max-file according to your needs.
Delivery Models
In more advanced environments, engineers may choose to adopt alternative logging models like Syslog, fluentd, and others instead of the default JSON drivers. However, it is crucial to keep in mind that the JSON-file driver is suitable for most logging scenarios, and there may not be a necessity to deviate from the default mode. Depending on the architecture of your application or the requirements of your organization, you might be compelled to utilize centralized logging solutions known as Log Aggregators.
These services, such as Elasticsearch, Logstash, Kibana, etc., are specifically designed to receive logs from various sources and consolidate, store, and analyze them in a single central location.
Conversely, you should store your logs using more cost-effective storage solutions. Consider the scenario where your VPS uses high-speed and expensive storage; it may not be economical to utilize such premium resources for storing logs that you might only need for future reference.
Numerous logging models are available, each with advantages and disadvantages. Evaluating each model carefully and selecting one based on your specific needs is essential.
Read More; Windows VPS Security: Protect Your Digital Assets
Our Plans ; Rent GPU Dedicated Server

